The Charting Method of Note-Taking in 5 Simple Steps
Here is a summary of the charting method of note-taking:
- It involves organizing your notes into a summary table.
- It makes it easy to compare and contrast multiple instances of a topic.
- It makes it possible to condense a large volume of notes.
If you’re studying for a class with a lot of information and feel overwhelmed, the charting method may be the right solution.
In this post, I’ll be covering:
- What the charting method is
- What makes the method effective
- Pros and cons of the method
- How to take charting notes in 5 simple steps
- How to effectively study charting notes
Let’s dive in!
What is the Charting Method of Note-Taking?
The charting method is a note-taking strategy in which you organize information into rows and columns, as seen below:

When to Use the Charting Method
The charting method comes in handy when:
- You need to memorize a lot of facts or statistics.
- You need to study multiple instances of a topic (e.g., types of psychological disorders, types of lab equipment).
- You want to compare and contrast information (e.g., characteristics of migration in America across different periods, themes explored by various Renaissance novels)
The charting method may not be suitable for technical courses involving a lot of equations and formulas. There’s not much to compare and contrast in such cases, and you’d be better off doing practice problems than charting your notes.
You may also like “14 Effective & Efficient Note-Taking Methods”
What Makes the Charting Method Effective?
Charting Condenses Information
The charting method makes it easy to condense a large volume of information. In the video below, you can see how one student condensed 79 pages of lecture slides onto a 4-page summary table.Play
Charting Promotes Visual Learning
The visual classification provided by the charting method can reinforce learning. Also, you can supplement your learning by adding pictures/diagrams to your chart.
You may choose to hand draw pictures. According to this study, drawing helped students encode information better.
However, you may also use online images. According to this study, students provided with diagrams to study exhibited better recall and test performance.
Charting Method Advantages and Disadvantages
The charting method can be very useful in some circumstances but not in others. It’s up to you to evaluate its applicability in any given situation.
Advantages
- You can compare and contrast information easily.
- You can condense material by putting the most relevant content in a summary table.
- You can add diagrams that supplement your learning.
- You can adapt the charting method to a digital format.
You may also like “Best Aesthetic Note Taking App (Free & Easy-to-Use)”
Disadvantages
- You generally can’t use charting during a live lecture.
- You shouldn’t use charting for technical classes, where doing practice problems would be more useful.
- You need to set up the table (although doing it digitally can facilitate the process).
How to Use the Charting Method in 5 Steps
Step #1: Jot down a List of Specific Instances
The charting method works best when there are multiple instances of a topic. What are the instances you’ll be comparing and contrasting? Make a list.
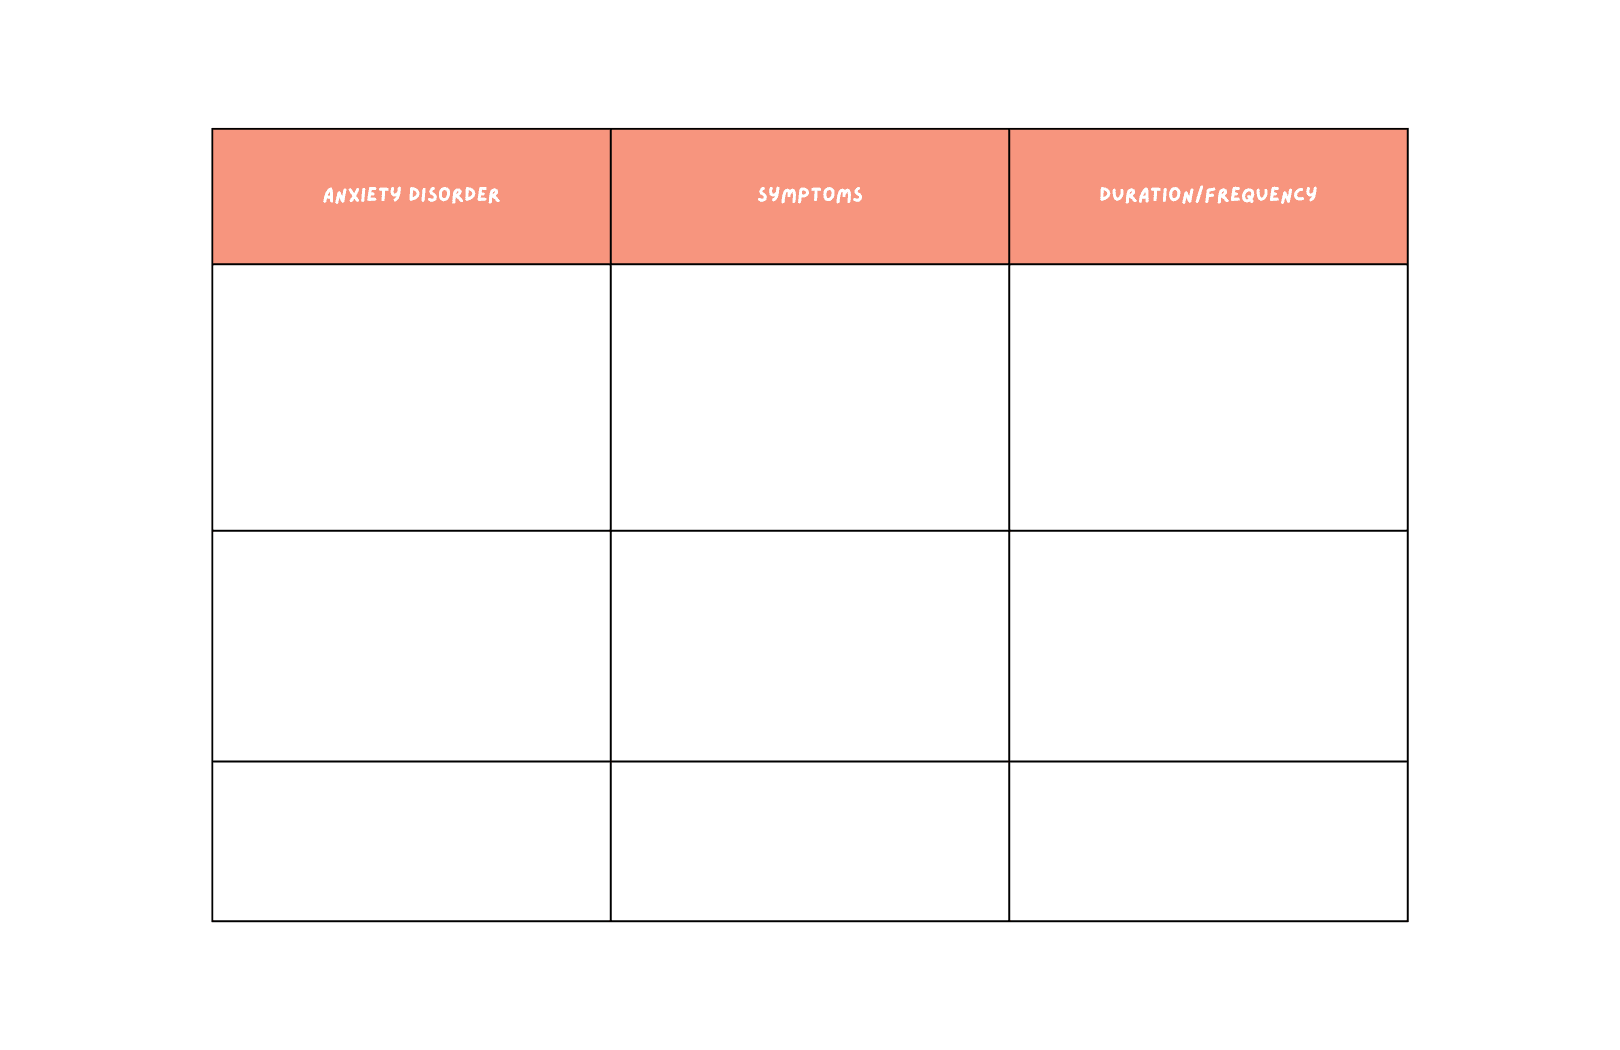
In the example below, the topic is anxiety disorders, and the instances I want to compare are generalized anxiety disorder, social phobia, and agoraphobia.

Step #2: Jot Down a List of the Characteristics
Make a list of the characteristics you want to compare and contrast. These characteristics will become the headers of your columns.
In the example below, the characteristics I want to compare and contrast are symptoms and duration/frequency.

Step #3: Set Up the Table
Now, you’re ready to set up your table. Your table should have the same number of rows as the number of specific instances (+ 1 row for the header). It should have the same number of columns as the number of characteristics (+ 1 column for the specific instances).
You can hand draw your chart or set it up digitally. Good options for digital platforms include:
- Microsoft Word
- Microsoft Excel
- Google Docs
- Google Spreadsheets
If you choose to set up your chart digitally, you can print it out later. Or, you can export the chart to a notes mark-up app like Notability to further revise your notes.
The image below is not of a chart but of lecture slides. However, you can see how I’m able to mark up notes in Notability:

Step #4: Fill in the Information
Now that you’ve set up your table, it’s time to fill in the information. Don’t be overly detailed—focus on the most relevant information so that you can compare and contrast the instances easily.
Also, add diagrams where applicable because studying with visuals facilitates learning.
Step #5: Review Your Notes
Do you ever feel like you forget almost everything right after you learn it? This isn’t surprising due to a phenomenon known as the Ebbinghaus Forgetting Curve.
According to the Forgetting Curve, we forget on average 90% of new concepts we learn after being exposed to them once. Therefore, it’s essential to review your notes within 24 hours of taking them.
However, there are effective and not-so-effective ways to study your notes. This leads me to the next section…
You may also like “5 Ways to Increase Attention Span While Studying Immediately”
How to Study Charting Notes
Use Active Recall
Active recall is an effective studying strategy that should be part of every student’s routine. Instead of relying on an external source (like your notes or a textbook), active recall requires you to pull information from your existing knowledge base.
Yes, it will feel hard. But like any other muscle, it is only by working your brain that you can strengthen it. Rereading notes is ineffective because your brain doesn’t need to actively process information.
In contrast, active recall strengthens the neural connections of your brain and helps you retain information. When reviewing your chart, you shouldn’t just scan over its contents. Instead, look at each instance in the left-hand column and try to recall details about their characteristics before checking the table.
Employ Critical Thinking
To supplement the encoding of information, you must use critical thinking. If you set up a digital chart, I recommend printing it out or exporting it to a mark-up app (like Notability).
As you’re reviewing your notes, consider 3 things:
- How the concepts in the table relate to one another
- How the concepts relate to prior knowledge
- Real-world examples of the concepts
Jot these down in the margins.
You may also like “7 Secret Tips For Studying That Will Transform How You Study”
Use Spaced Repetition
Spaced repetition is the most effective weapon against the Ebbinghaus Forgetting Curve. Just like it sounds, it requires you to periodically review information.
Luckily, you can space out subsequent review sessions in greater and greater intervals.
According to computer researcher Piotr Wozniak, who created SuperMemo (an algorithm that determines when to do spaced rep sessions), the best spaced rep intervals are:
- 1st rep: 1 day after the date learned
- 2nd rep: 7 days after the date learned
- 3rd rep: 16 days after the date learned
- 4th rep: 35 days after the date learned
I used to neglect spaced repetition because it felt like a hassle. However, I’ve since automated my spaced repetition study schedule in Notion. Instead of having to mark each subsequent review date in my calendar, Notion determines the next review date based on my previous date and the number of repetitions I’ve done.
Check out this post to learn more about how to organize and take notes in Notion.

FAQ
What are the advantages of the charting method?
The charting method of note-taking provides an easy way to compare and contrast information not seen in other note-taking methods. It also makes it possible to condense a large volume of information into a summary table.
Additionally, adding diagrams to your chart can help you learn and memorize information faster.
What is the main purpose of charting?
The main purpose of charting is to organize information in a visually categorized format. Doing so makes it convenient to study the main characteristics of instances of a topic and to compare those characteristics.
When should you use the charting method?
You should use the charting method when there are multiple instances of a topic that you want to compare and contrast. You should also use it if you have a large volume of factual/statistical information to study that’s overwhelming without organization.
Cases where the charting method is not applicable include:
- Note-taking during a live lecture
- Technical courses with lots of equations and formulas
Note-taking methods like the outline method, Cornell note-taking method, or sentence method may be more applicable in the former case. Note-taking methods like the flow method or T-chart method may be more applicable to the latter.
What are the most effective note-taking methods?
There is no “most effective” note-taking method because different note-taking methods work well in different situations. However, scientifically speaking, the learning process is facilitated by active recall and critical thinking. As such, note-taking methods that integrate these characteristics can help you learn and retain information.
The charting method of note-taking is generally not applicable when learning information for the first time. However, after you’ve learned something, it’s a great way to organize information in a clear format.
By employing active recall, critical thinking, and spaced repetition when reviewing your chart (as discussed in the section called “How to Study Charting Notes”), you can improve your retention and understanding.
Overview of the Charting Method of Note-Taking
The charting method of note-taking is most applicable when you want to compare and contrast multiple instances of some topic. You organize information into a table, placing information based on the instance and characteristic it’s associated with.
If you need to study a lot of factual or statistical information, the charting method provides a way to organize and condense otherwise overwhelming material.
Here is how to apply the charting method in 5 steps:
- Make a list of specific instances.
- Make a list of characteristics associated with those instances.
- Set up the table, with the characteristics listed in the column headers and the names of the instances listed in the row headers.
- Fill in the information. Add diagrams where possible.
- Review your notes using active recall, critical thinking, and spaced repetition.
I hope you now know how to use the charting method of note-taking in your studies!
For more on note-taking, check out these posts:
- The Outline Method of Note-Taking
- The Charting Method of Note-Taking
- The Sentence Method of Note-Taking
- The Boxing Method of Note-Taking
- The Flow Method of Note-Taking
For more posts on studying and note-taking, check out:
- 7-Day Dopamine Detox for Studying—Skyrocket Your Focus Now!
- Best Aesthetic Note Taking App (Free & Easy-to-Use)
- How to Apply Atomic Habits to Studying to Get Better Grades
- How to Wake Up at 5am to Study—Tips From a Former Night Owl
- 11 Ways to Stop Getting Distracted by YouTube While Studying
- 7 Secret Tips For Studying That Will Transform How You Study
What subjects do you intend to use the charting method for? Let me know in the comments below!
Want a head start? The Ultimate Student Planner in my shop was made for exactly this — it’ll save you a ton of time.